Understanding quiz analytics
Lantern provides comprehensive tools to help you track quiz performance and gather valuable insights. These tools are divided into two main categories: built-in reporting and analytics, and third-party tracking integrations. Let’s dive into both sections.
Built-In Reporting and Analytics
Lantern offers a wide range of built-in analytics accessible through Reporting -> Analytics.
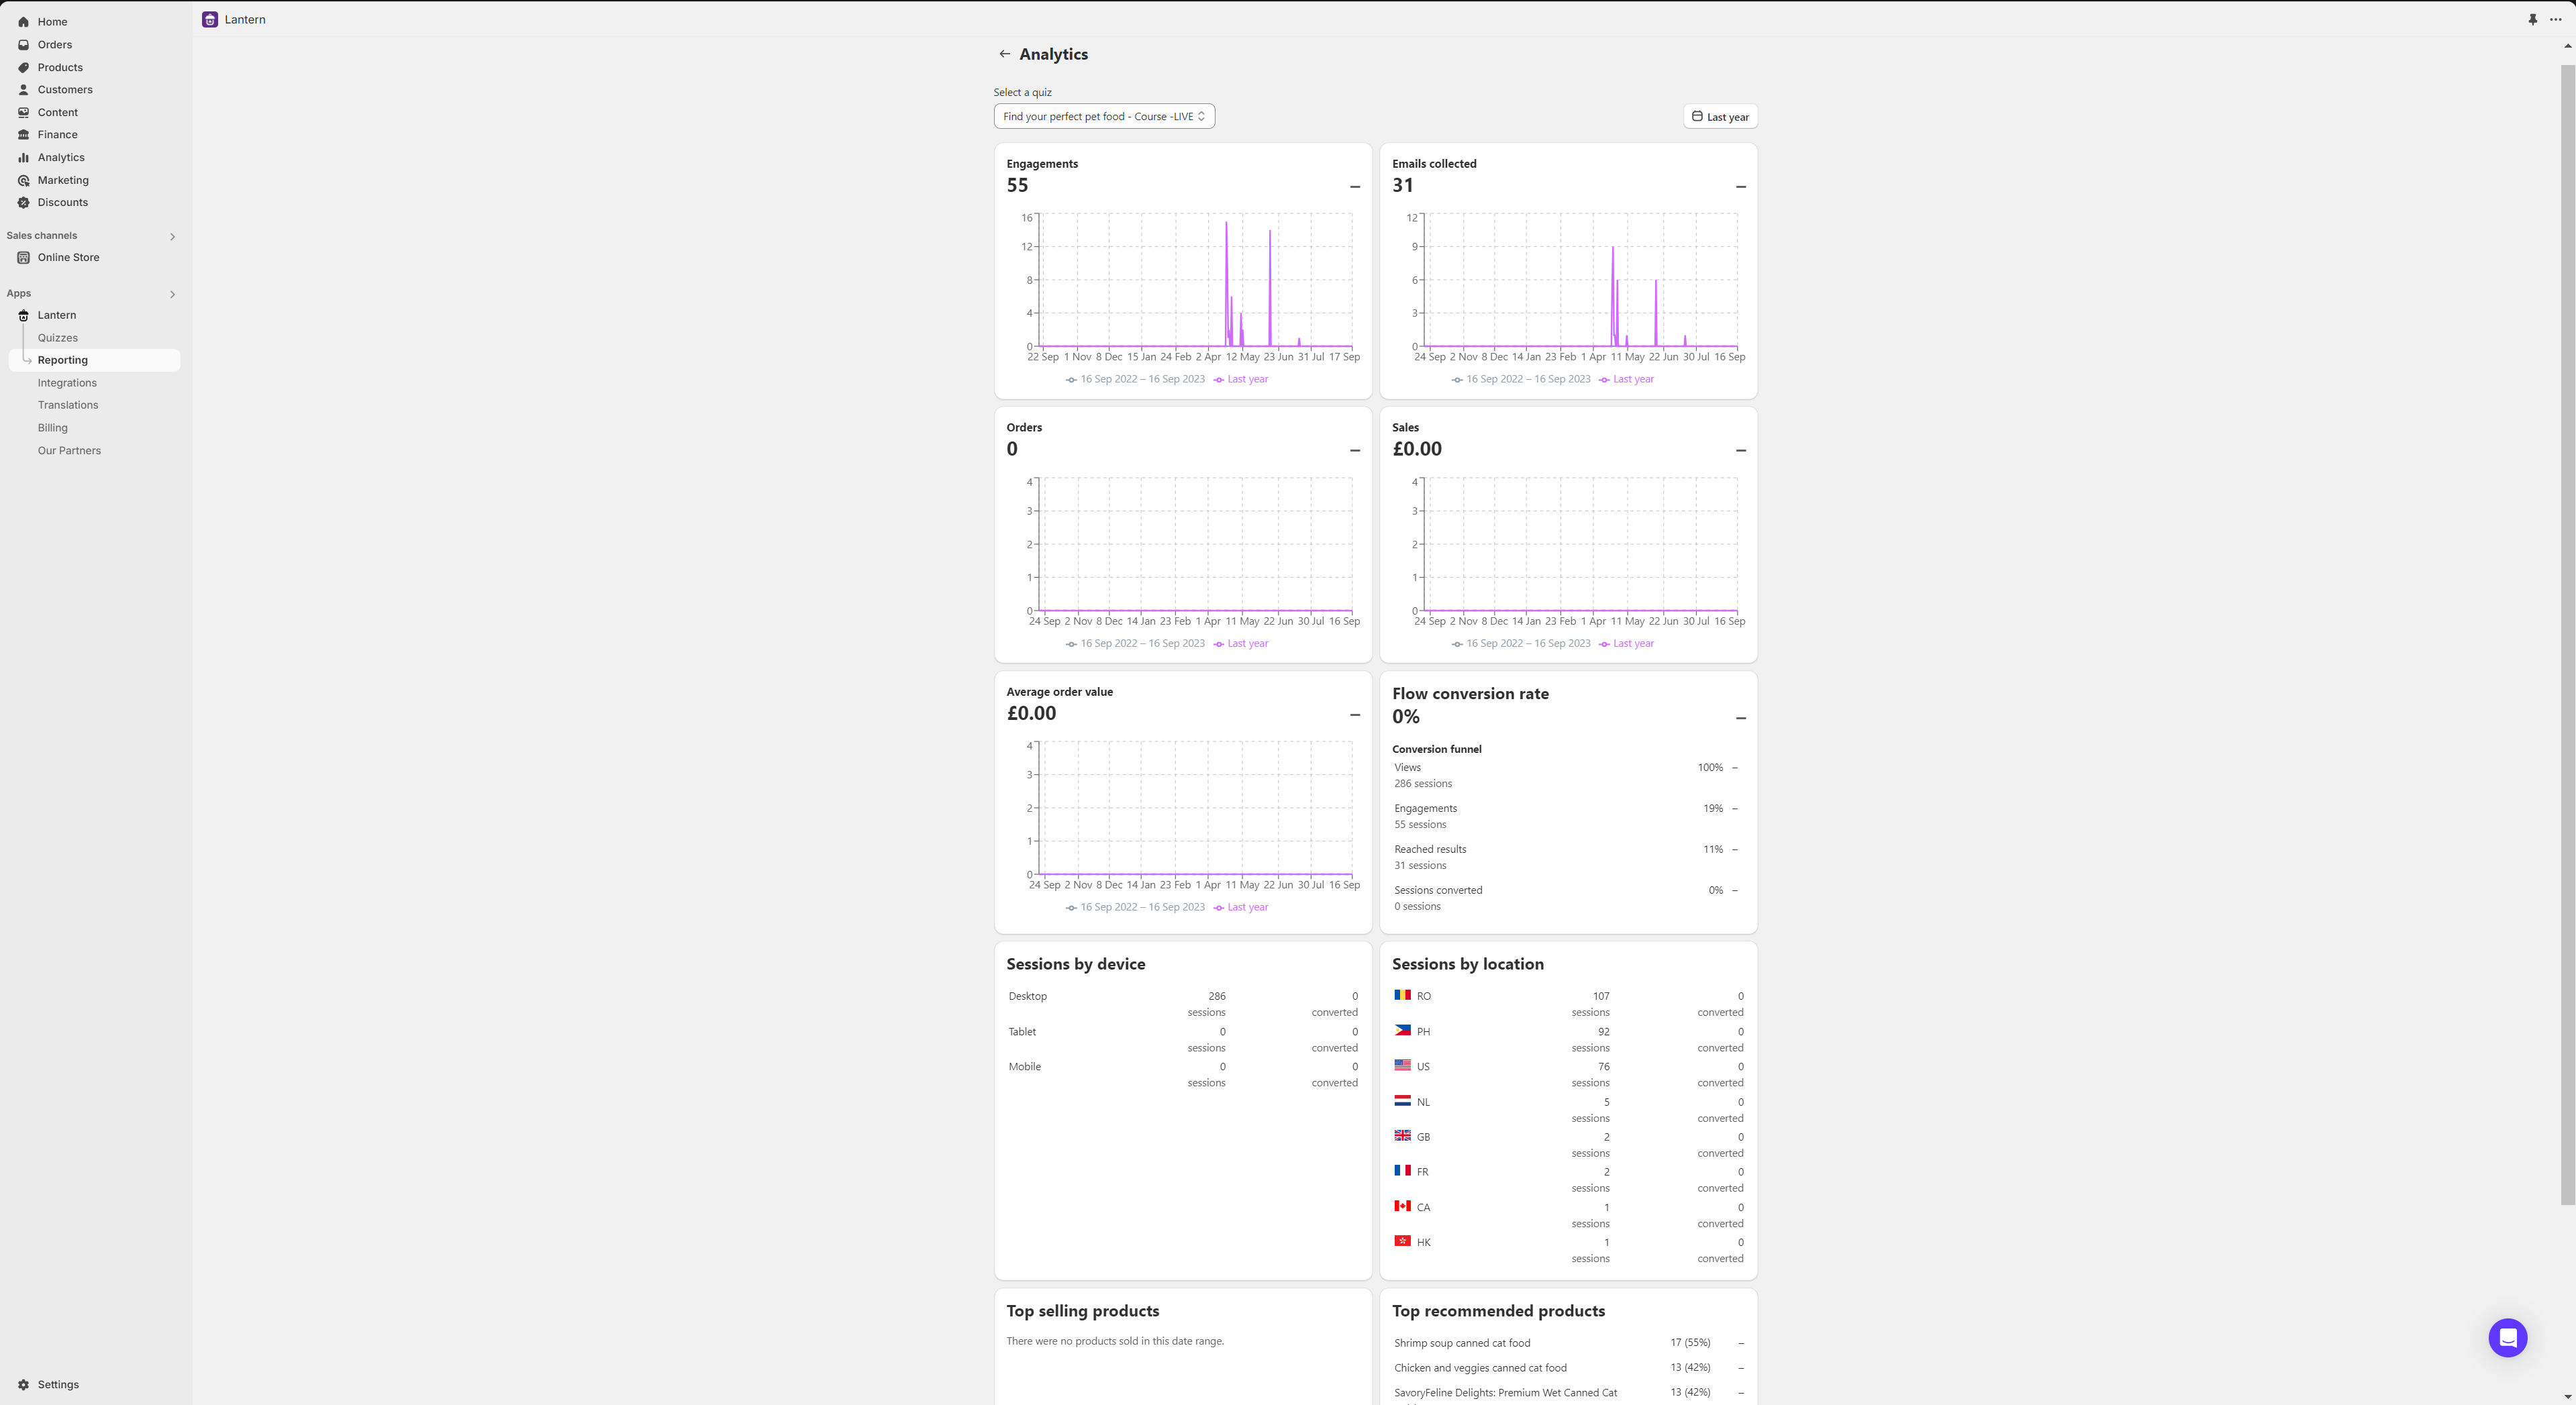
Here, you can track the following essential metrics:
- Engagements: While some other apps might count engagements as people that only opened the flow, we don’t think that is fair. With the Lantern, an engagement is when someone has started and answered at least one question of the guided selling funnel.
- Emails Collected: The number of users who provided their email address during the quiz.
- Orders: The total number of purchases made after completing the quiz.
- Sales: The total revenue generated from orders made based on quiz results.
- Average Order Value (AOV): The average amount spent per order made after completing the quiz.
- Flow Conversion Rate: Tracks user behavior at different stages of the quiz:
- Views: For embedded quizzes, views are counted every time someone scrolls over the quiz embed, regardless if they click anything or start the quiz. For quiz URLs, a view is counted only when someone clicks on the link.
- Engagements: When someone has started and answered at least one question of the guided selling funnel.
- Reached Results: The number of users who completed the quiz and reached the results page.
- Sessions Converted: The percentage of users who made a purchase after completing the quiz.
- Sessions by Device: Provides data on the types of devices (mobile, desktop, etc.) used by quiz participants.
- Sessions by Location: Displays the geographic locations of quiz participants.
- Top Selling Products: The products that generated the most sales through quiz recommendations.
- Top Recommended Products: The products that were most frequently recommended to quiz participants.
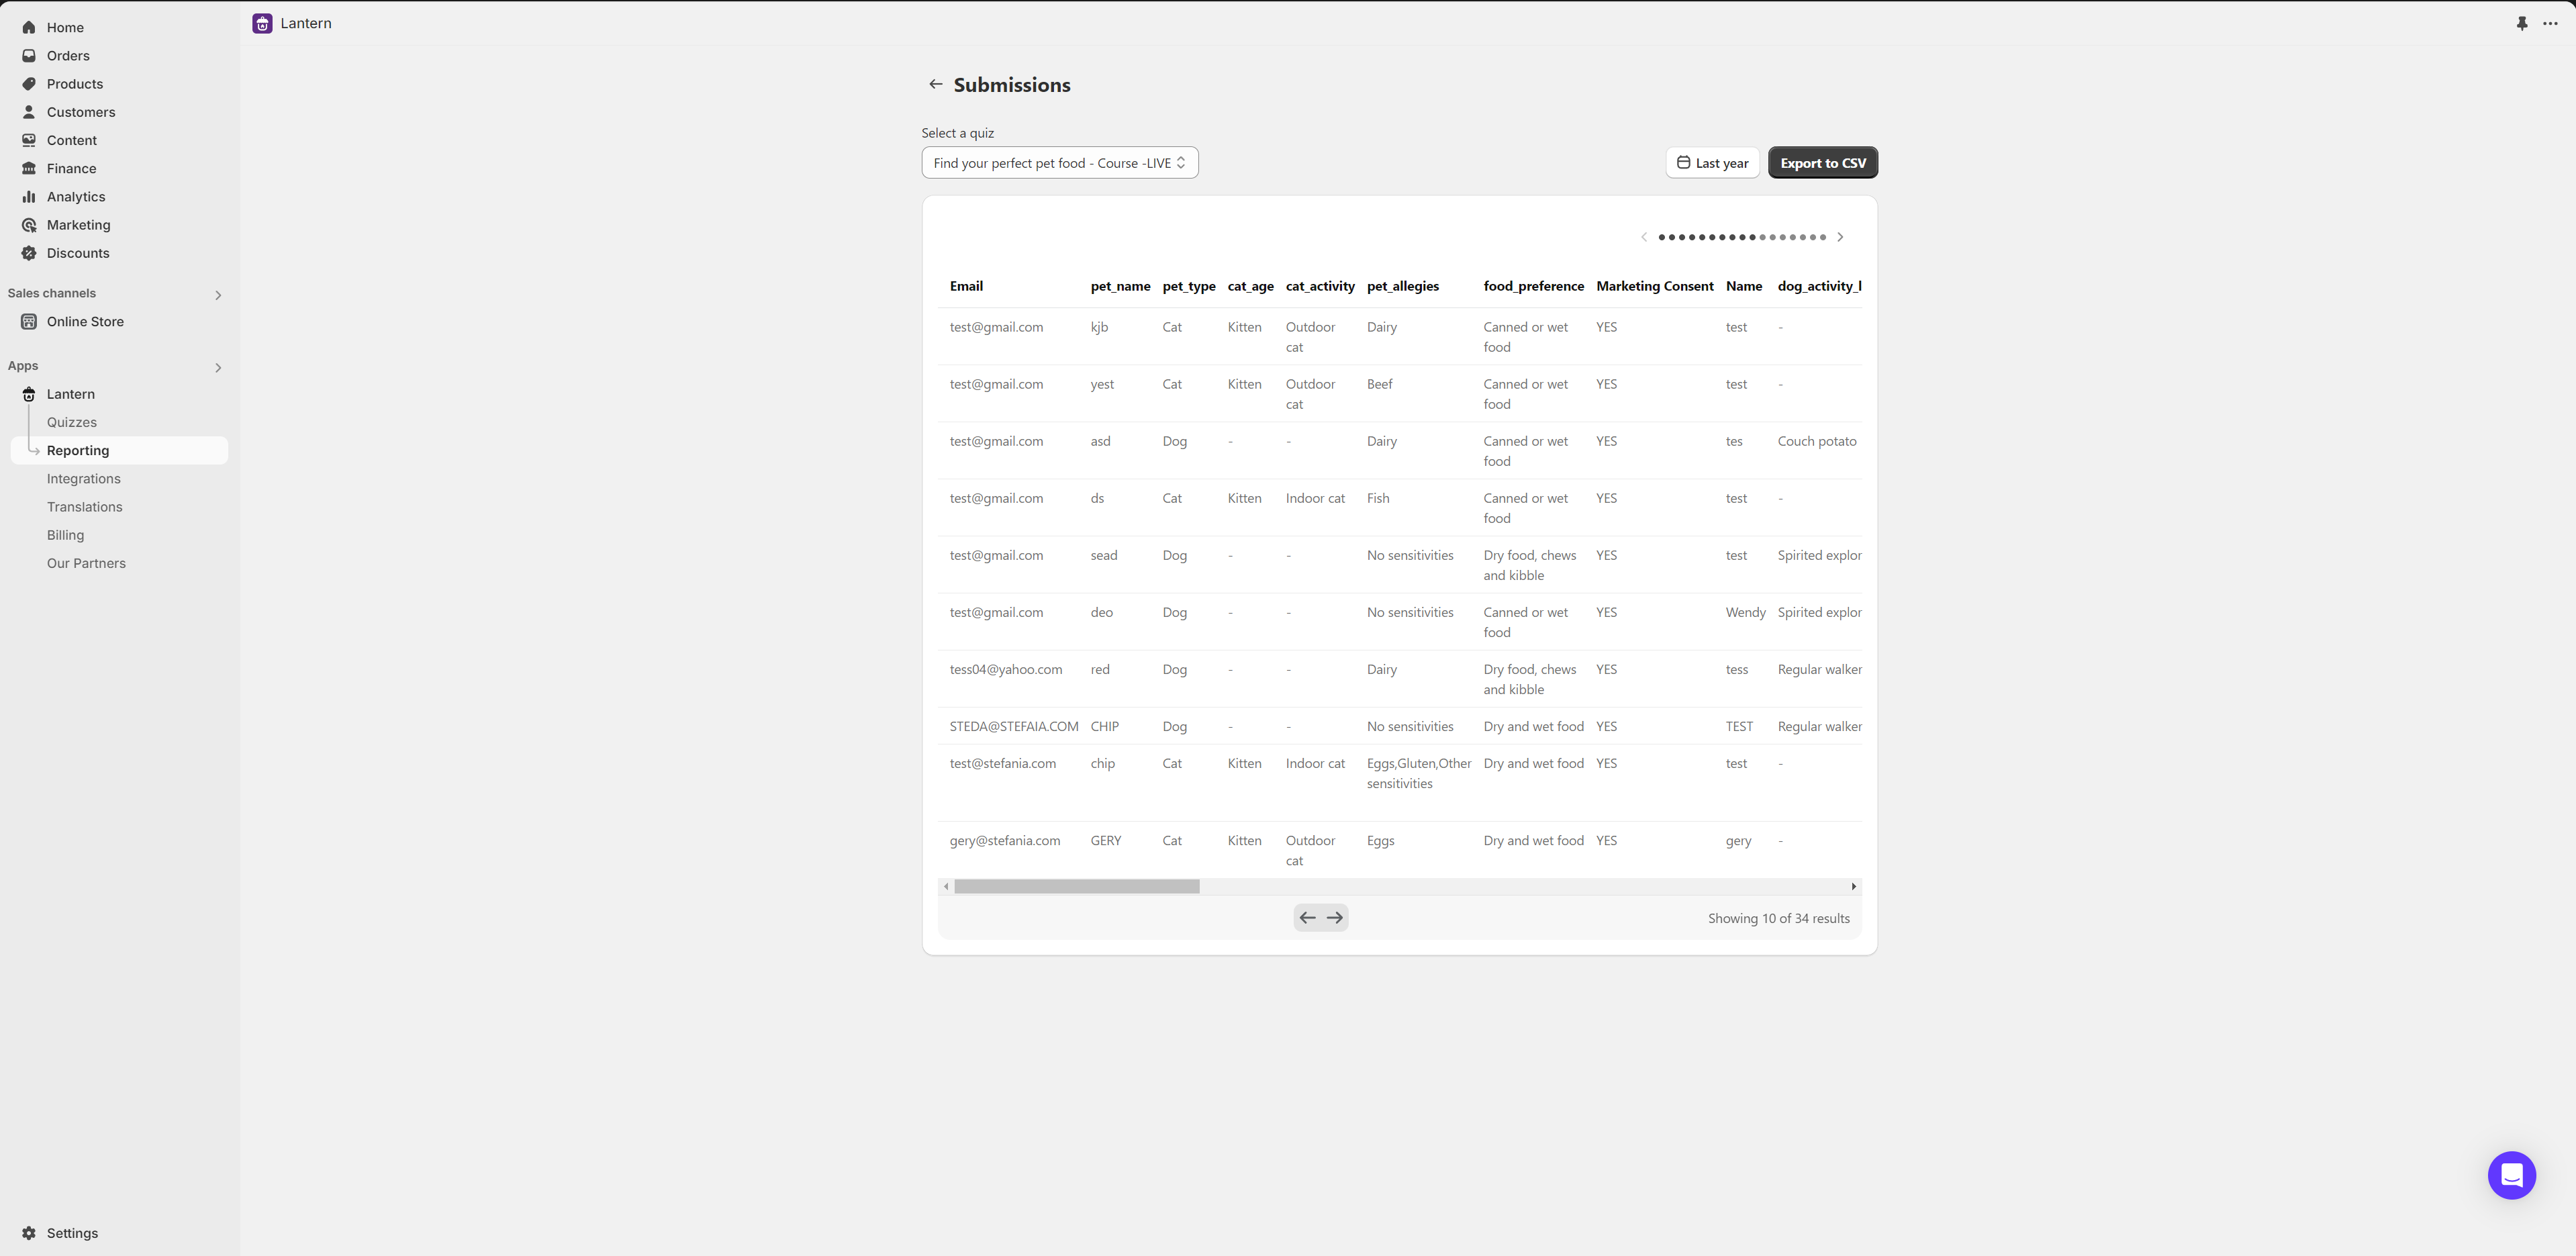
Additionally, under Reporting -> Submissions, you can review detailed quiz completion data. This includes the answers users selected and the saved static URL for each user’s results page.
For more detailed insights, the Reporting -> Sessions section provides analytics on quiz engagement status, location data, and customer emails (if provided).
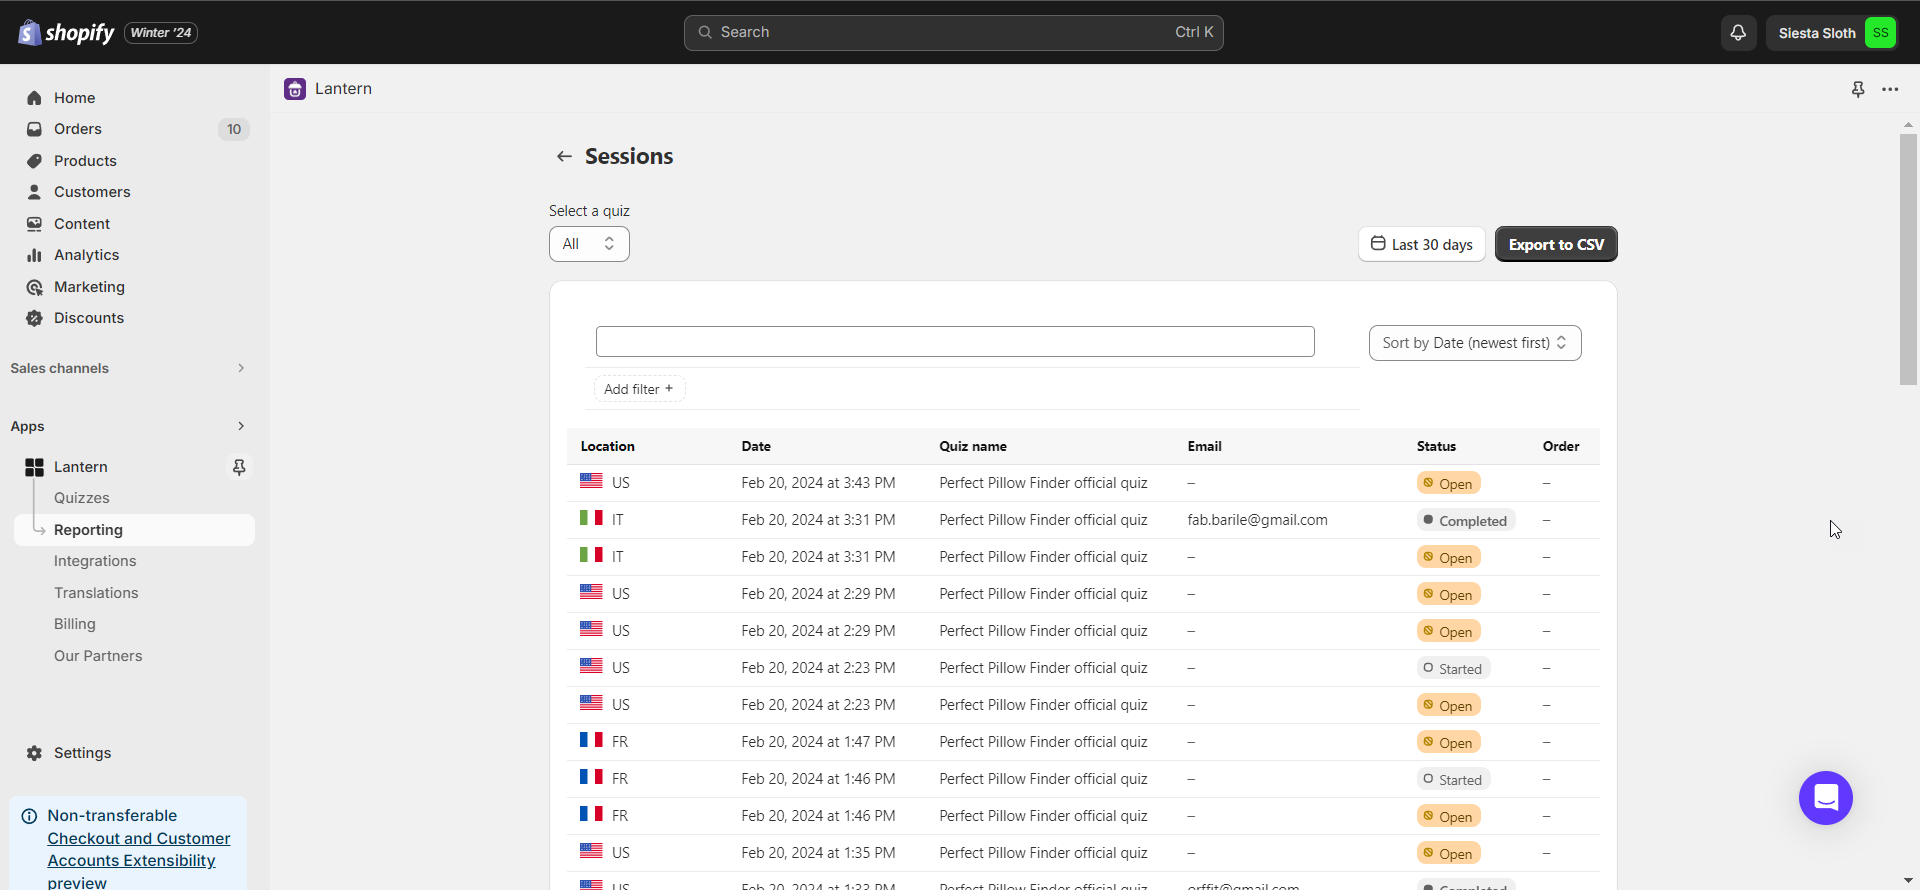
Engagement statuses include:
- Open: This means that customers clicked the quiz URL and opened the quiz but abandoned it without answering any questions. This would also count if you previewed the quiz without responding to any questions.
- Started: Customers have answered at least one question but did not complete the quiz.
- Completed: The quiz was fully completed, and customers reached the results page.
- Converted: A purchase was made immediately after completing the quiz.
Third-Party Tracking Integrations
For more advanced tracking, Lantern allows you to integrate third-party analytics tools through the custom Tracking Code section under Settings. Here, you can input Javascript tracking codes from platforms like Facebook/Meta, Google, and Microsoft Analytics.
Lantern organizes tracking code sections into two areas: one for code that should be inserted in the head of the page and another for code that belongs in the body of the page.
If you need additional support with adding 3rd party tracking software to your quiz we recommend Storetasker. They are highly trusted Lantern partners, that have helped thousands of Shopify merchants hire expert freelancers for anything related to their store.
For any help or questions, feel free to reach out to our support team.